Let's start with what is not healthcare marketing ROI:
- Number of website visitors
- Social media followers
- Number of Google Ads impressions
- Email open rate
- Number of blog posts published
- Google ranking position (as an isolated metric)
All of these are activity metrics. They tell you what happened in your marketing, not what that marketing was worth.
ROI is revenue minus cost, divided by cost, expressed as a percentage. For marketing: (Revenue attributable to marketing − Marketing cost) / Marketing cost × 100.
If you spent ₹1 crore on marketing and generated ₹3.2 crore in revenue from patients who came through digital channels, your marketing ROI is 220%. If you generated ₹80 lakh, your ROI is negative — you're losing money on marketing.
Most hospitals don't know which of these applies to them. That's the fundamental problem this guide addresses.
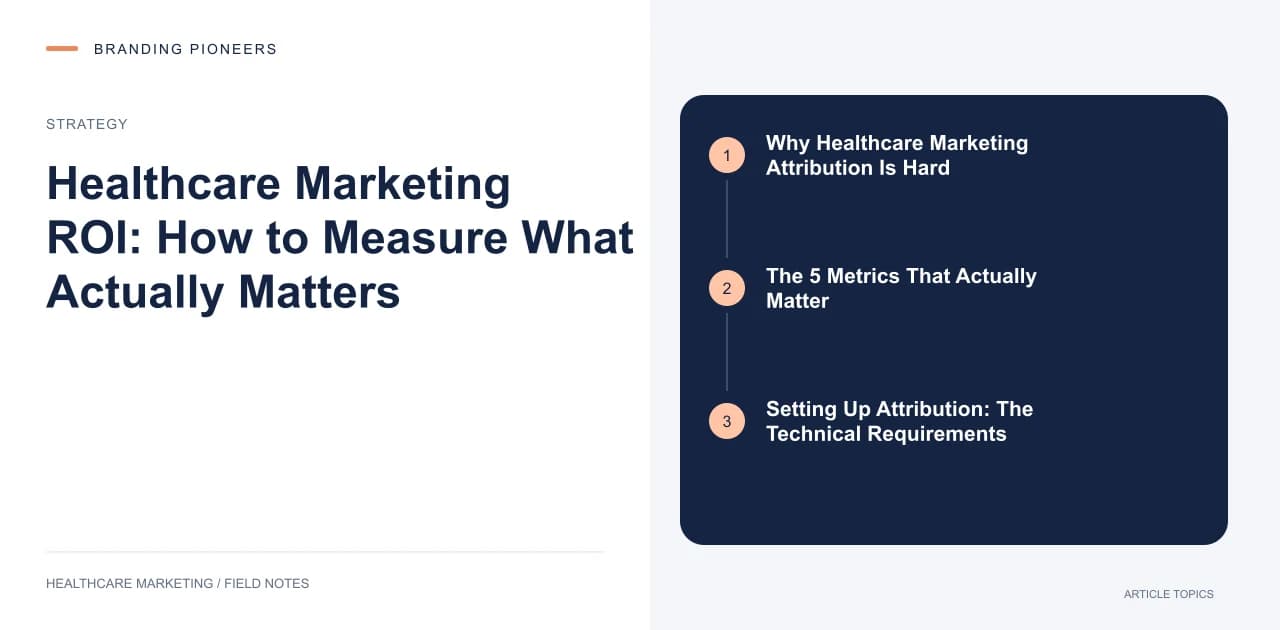
Why Healthcare Marketing Attribution Is Hard
Healthcare is harder to attribute than retail. A patient who saw your Instagram Reel in March, searched Google in April, read your doctor's blog post in May, and booked via WhatsApp in June — which touchpoint gets credit?
The answer: all of them contributed. This is why proper attribution requires:
- Consistent UTM tagging on every digital link — ads, social media posts, email campaigns, WhatsApp messages
- Google Analytics 4 configured to track conversions at every touchpoint
- A CRM that records lead source from the first touchpoint
- Phone call tracking (for patients who call rather than fill in forms)
Without these four elements, you're attributing revenue based on guesses.
The 5 Metrics That Actually Matter
1. Cost Per Patient Acquired (CPA) by Channel
The most important metric. CPA = Total channel spend ÷ Number of patients acquired from that channel.
Here's what this can look like in practice:
- Google Ads: ₹28 lakh spend → 680 patients → ₹4,117 CPA
- SEO (agency fees + content): ₹8 lakh → 340 patients → ₹2,352 CPA
- Meta Ads: ₹6 lakh → 48 patients → ₹12,500 CPA
- WhatsApp campaigns: ₹1.5 lakh → 85 patients → ₹1,765 CPA
This table immediately tells you: Meta Ads are producing patients at 3x the cost of Google Ads. WhatsApp campaigns are the most efficient channel. SEO outperforms Meta.
The logical response: shift budget from Meta to WhatsApp and SEO. This is usually quick to implement and often produces a meaningful improvement in overall CPA.
2. Patient Lifetime Value (LTV) by Channel
Not all patients are equal. A patient who comes for an annual health checkup and never returns has low LTV. A patient who comes for a cardiac procedure and continues using your hospital for 10 years of ongoing cardiac care has very high LTV.
If you can track LTV by source (which CRM makes possible), you may find that:
- Google Ads patients have average LTV of ₹28,000 over 24 months
- Referral patients have average LTV of ₹62,000 over 24 months
- Social media patients have average LTV of ₹14,000 over 24 months
Now compare that to CPA:
- Google Ads: ₹4,117 CPA, ₹28,000 LTV → ROI of 580%
- Referrals: ₹800 CPA (relationship management), ₹62,000 LTV → ROI of 7,650%
- Social media: ₹12,500 CPA, ₹14,000 LTV → ROI of 12% (barely breaking even)
This analysis, once done, fundamentally changes budget decisions. Most hospitals dramatically underinvest in referral marketing once they see the LTV data.
3. Conversion Rate by Stage
Track conversion rate at every stage of your funnel:
- Click to landing page visit (Google Ads: 70–85% is normal; lower indicates irrelevant traffic)
- Landing page visit to form submission or WhatsApp message (target: 3–7%)
- Form submission to consultation booked (target: 40–65% — depends heavily on response speed)
- Consultation booked to consultation attended (target: 80–90% — indicates appointment reminder effectiveness)
- Consultation to treatment confirmed (target: 30–60% — depends on specialty)
Each stage has leakage. The goal of conversion optimization is to reduce leakage at every stage.
4. Revenue per Lead Source
In your CRM, tag every lead with its source. When that lead becomes a patient and generates revenue, associate the revenue with the source. After 3–6 months of data collection, you have a table that looks like:
| Source | Leads | Patients | Revenue | CPA |
|---|---|---|---|---|
| Google Ads (Brand) | 180 | 140 | ₹42 lakh | ₹820 |
| Google Ads (Non-brand) | 520 | 180 | ₹38 lakh | ₹3,800 |
| Organic Search | 340 | 95 | ₹22 lakh | ₹1,850 |
| Referral (Doctor) | 90 | 74 | ₹52 lakh | ₹400 |
| WhatsApp Campaigns | 220 | 96 | ₹18 lakh | ₹1,100 |
This table drives every budget allocation decision for the next quarter.
5. Marketing-Attributed Revenue as % of Total Revenue
The headline metric for your board presentation: what percentage of total hospital revenue came from patients who discovered you through marketing?
Track this monthly. Growing this percentage — while maintaining or improving margins — is the fundamental goal of a hospital marketing function.
Benchmark targets:
- Year 1 of digital marketing: 15–25% of revenue from digital-attributed patients
- Year 2: 25–40%
- Year 3+: 35–55%
Hospitals above 55% of revenue from digital-attributed sources are heavily dependent on marketing — which creates a risk if spend must be cut. The goal is a healthy mix: digital-attributed + referral + repeat/retained patients.